Define Cohesive Observability
Creating a shared observability framework across AI, GPU, Kubernetes and infrastructure products — from 0→1 in three months.
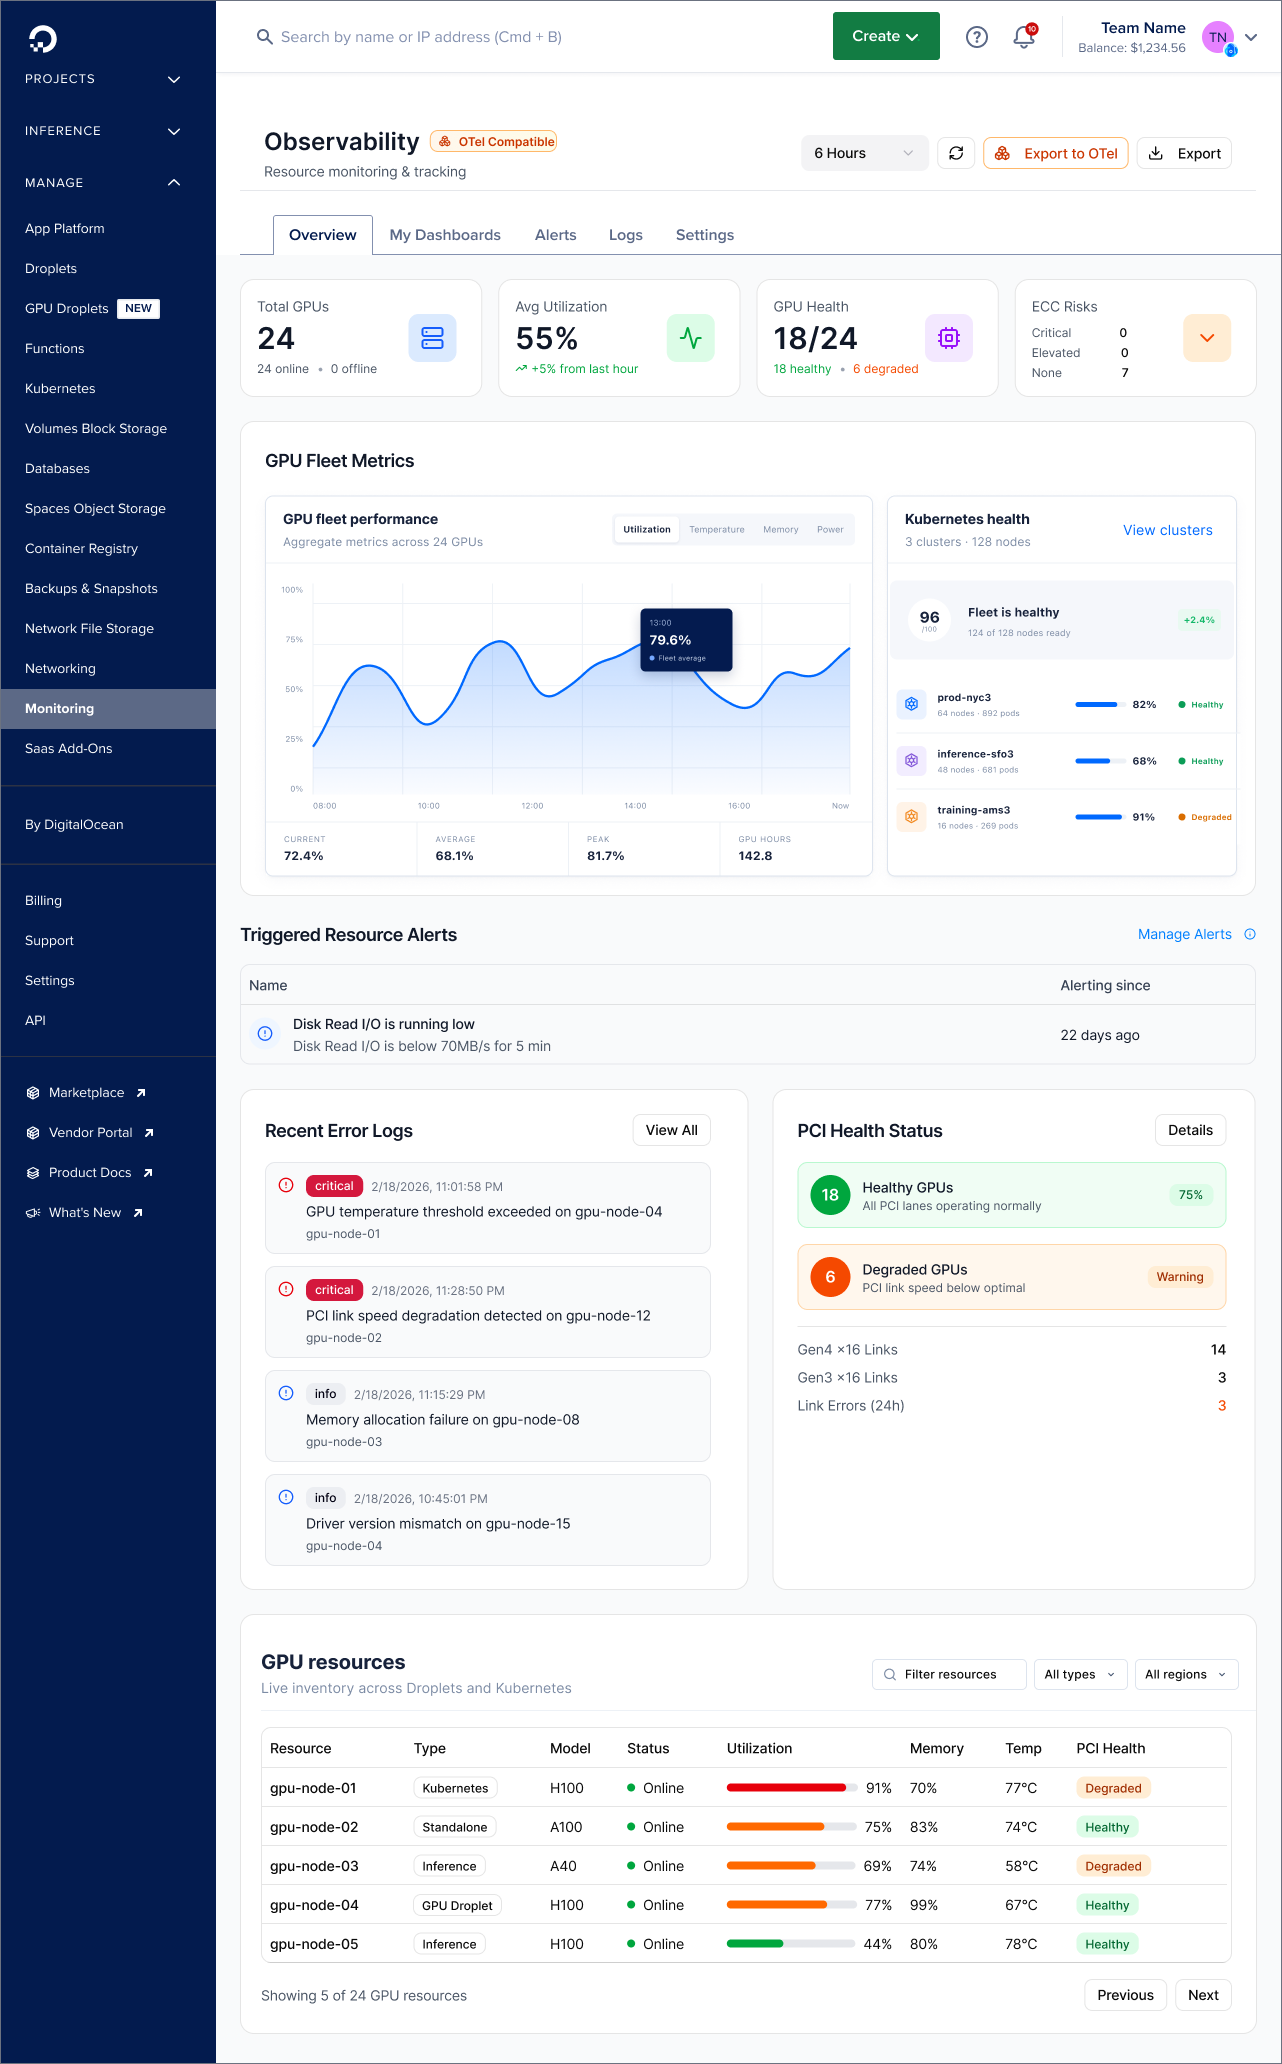
Multiple products. Different needs. One platform.
DigitalOcean was serving increasingly complex infrastructure products, including AI Inference, GPU compute and Kubernetes. Each needed observability, but teams were approaching it independently, with no shared definition of what observability meant across the company.
The challenge wasn’t designing dashboards. It was building a system flexible enough for very different technical products, while making observability feel like one cohesive DigitalOcean experience.
My role
I owned the end-to-end design direction, from the shared experience architecture to individual workflows and reusable patterns, and built alignment on what to standardize versus keep product-specific. AI-assisted prototyping was part of that process from the start.
Who we designed for
Lead devs & DevOps leads, CTOs, and GPU / Kubernetes power users. With a tight timeline, I ran 12 one-on-one interviews with internal users.
A cohesive platform that holds together
Early user feedback was positive and helped validate the direction, and the need for a more cohesive approach to observability.
AI in the product, and in the process
AI shaped this project three ways: as something we had to observe, as a core part of how I designed and prototyped, and as where observability is heading next.
Observability for AI itself
The platform covers the inference engine behind our AI products, not only the machines under it. Teams can see how inference is performing and what it costs, next to the GPU and Kubernetes layers it runs on.
AI as part of how I design
I used Figma Make, Lovable and Cursor to explore quickly and build code-based prototypes, so engineering had something concrete to react to early. Information architecture, telemetry strategy and tradeoffs stayed a human call.
Early design for agents
I started design work on agents that manage observability insights for Kubernetes: a first step from dashboards you read toward a system that helps you act on what it finds.
The platform in action
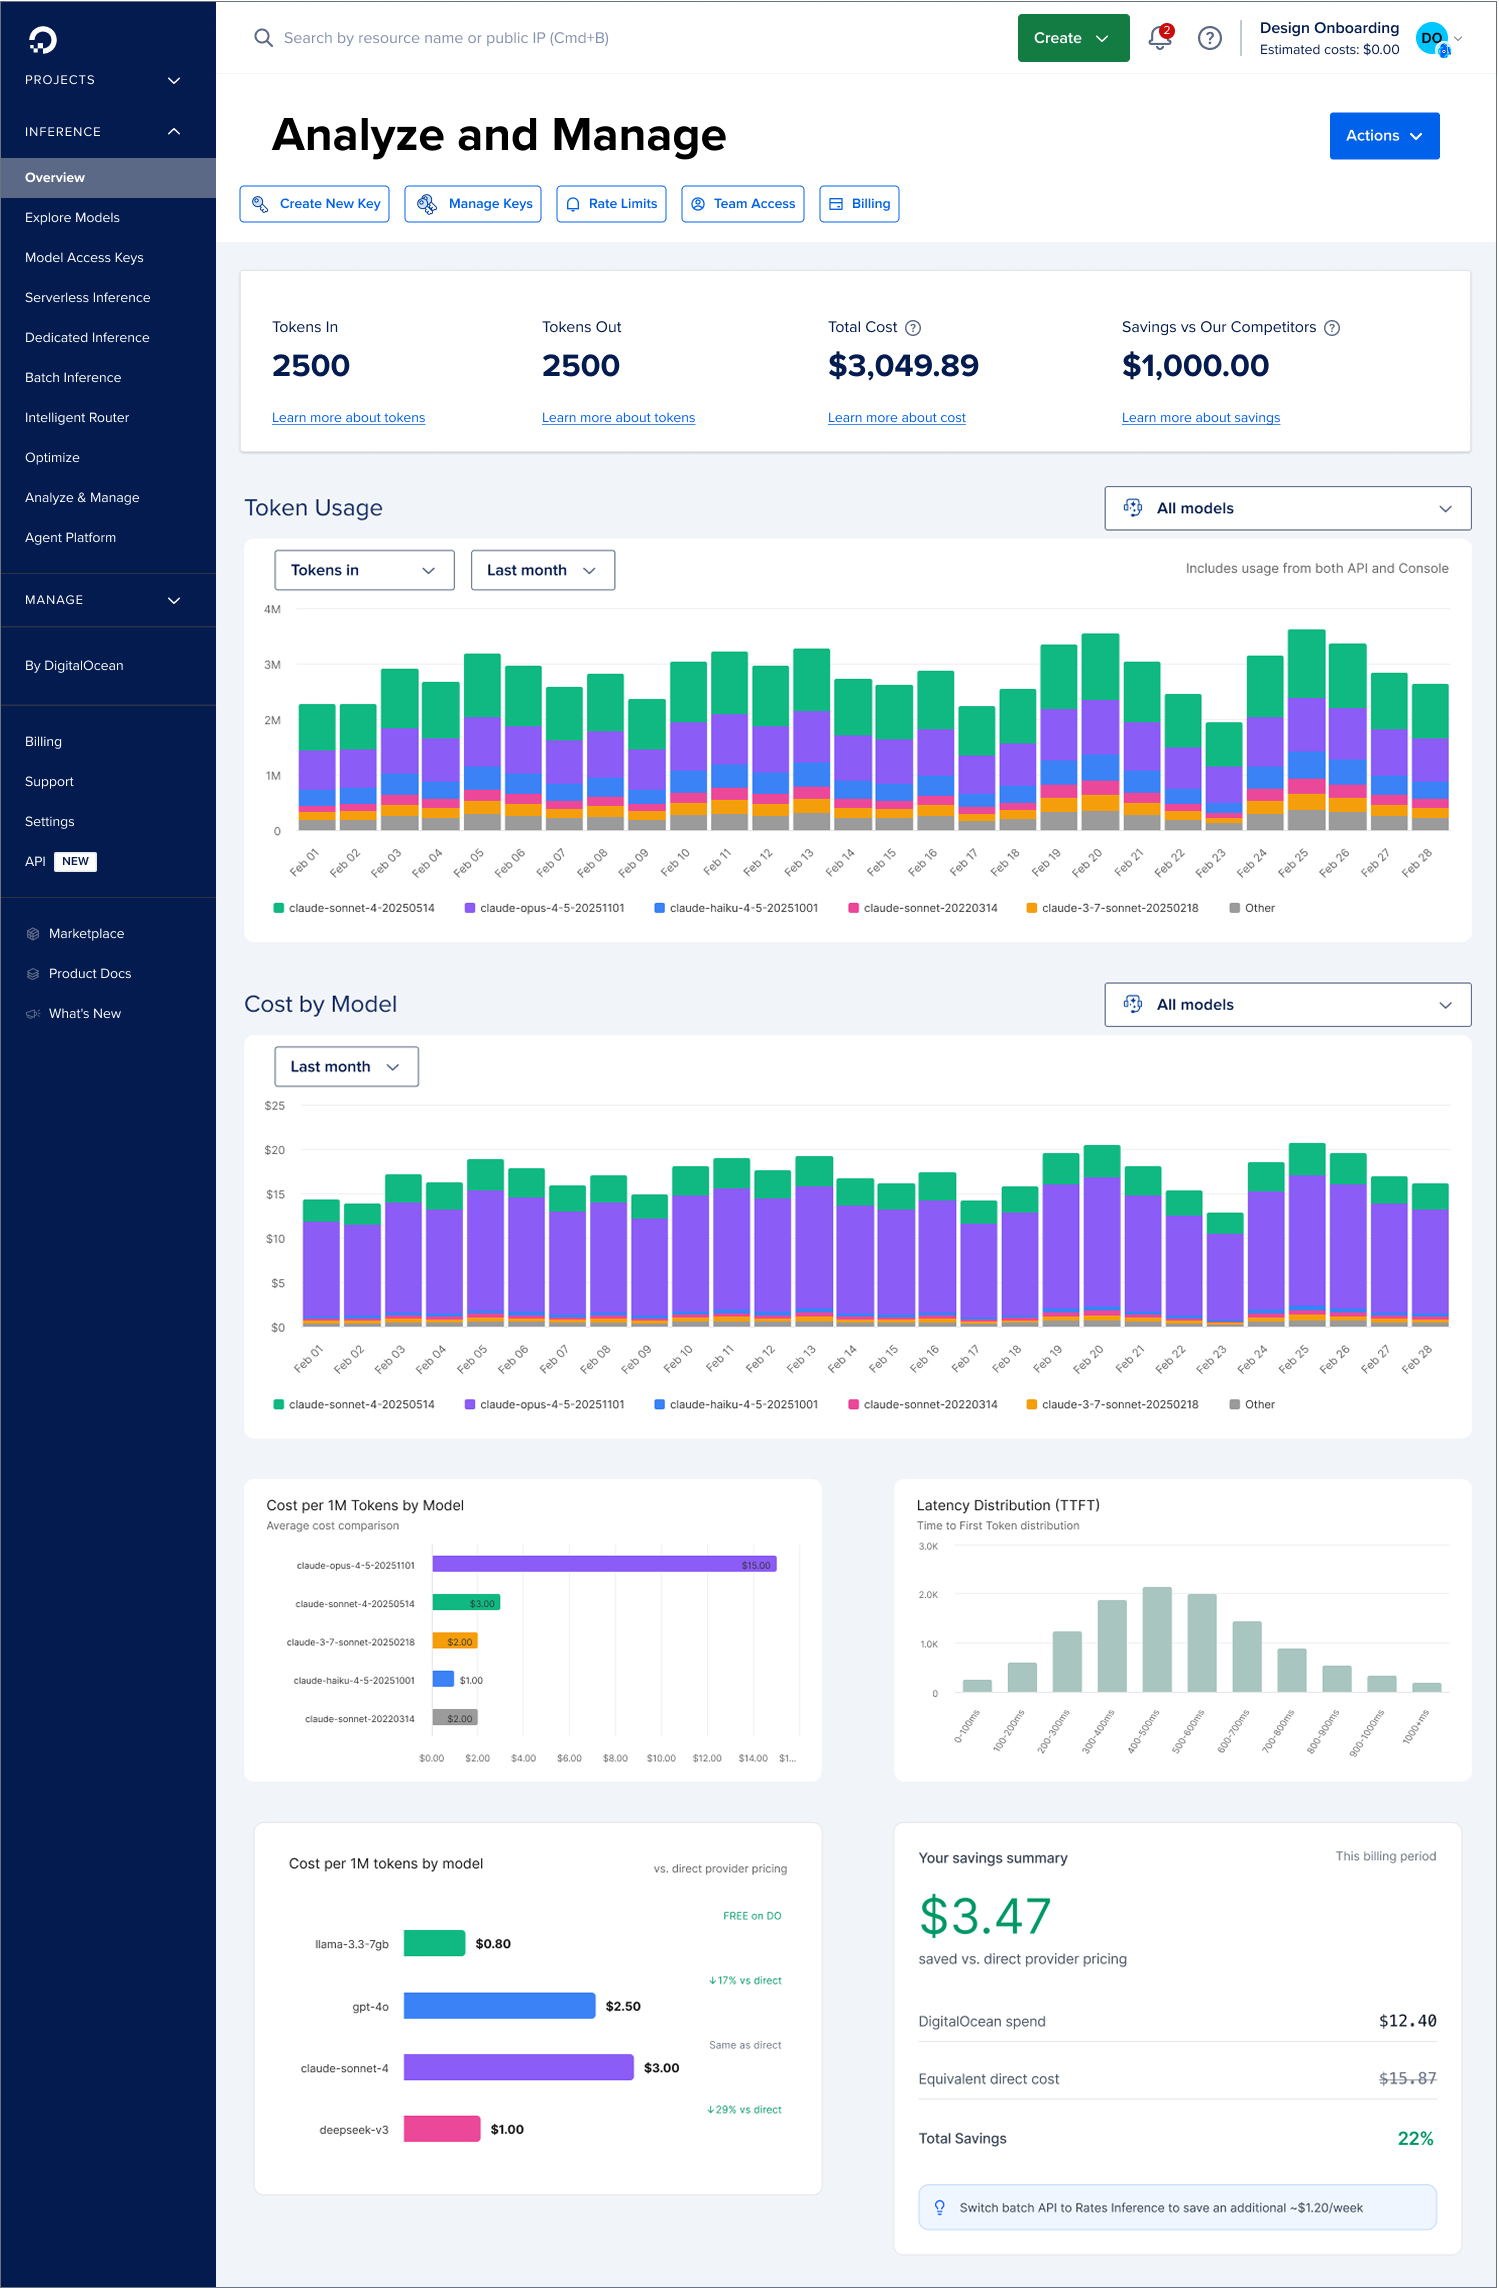
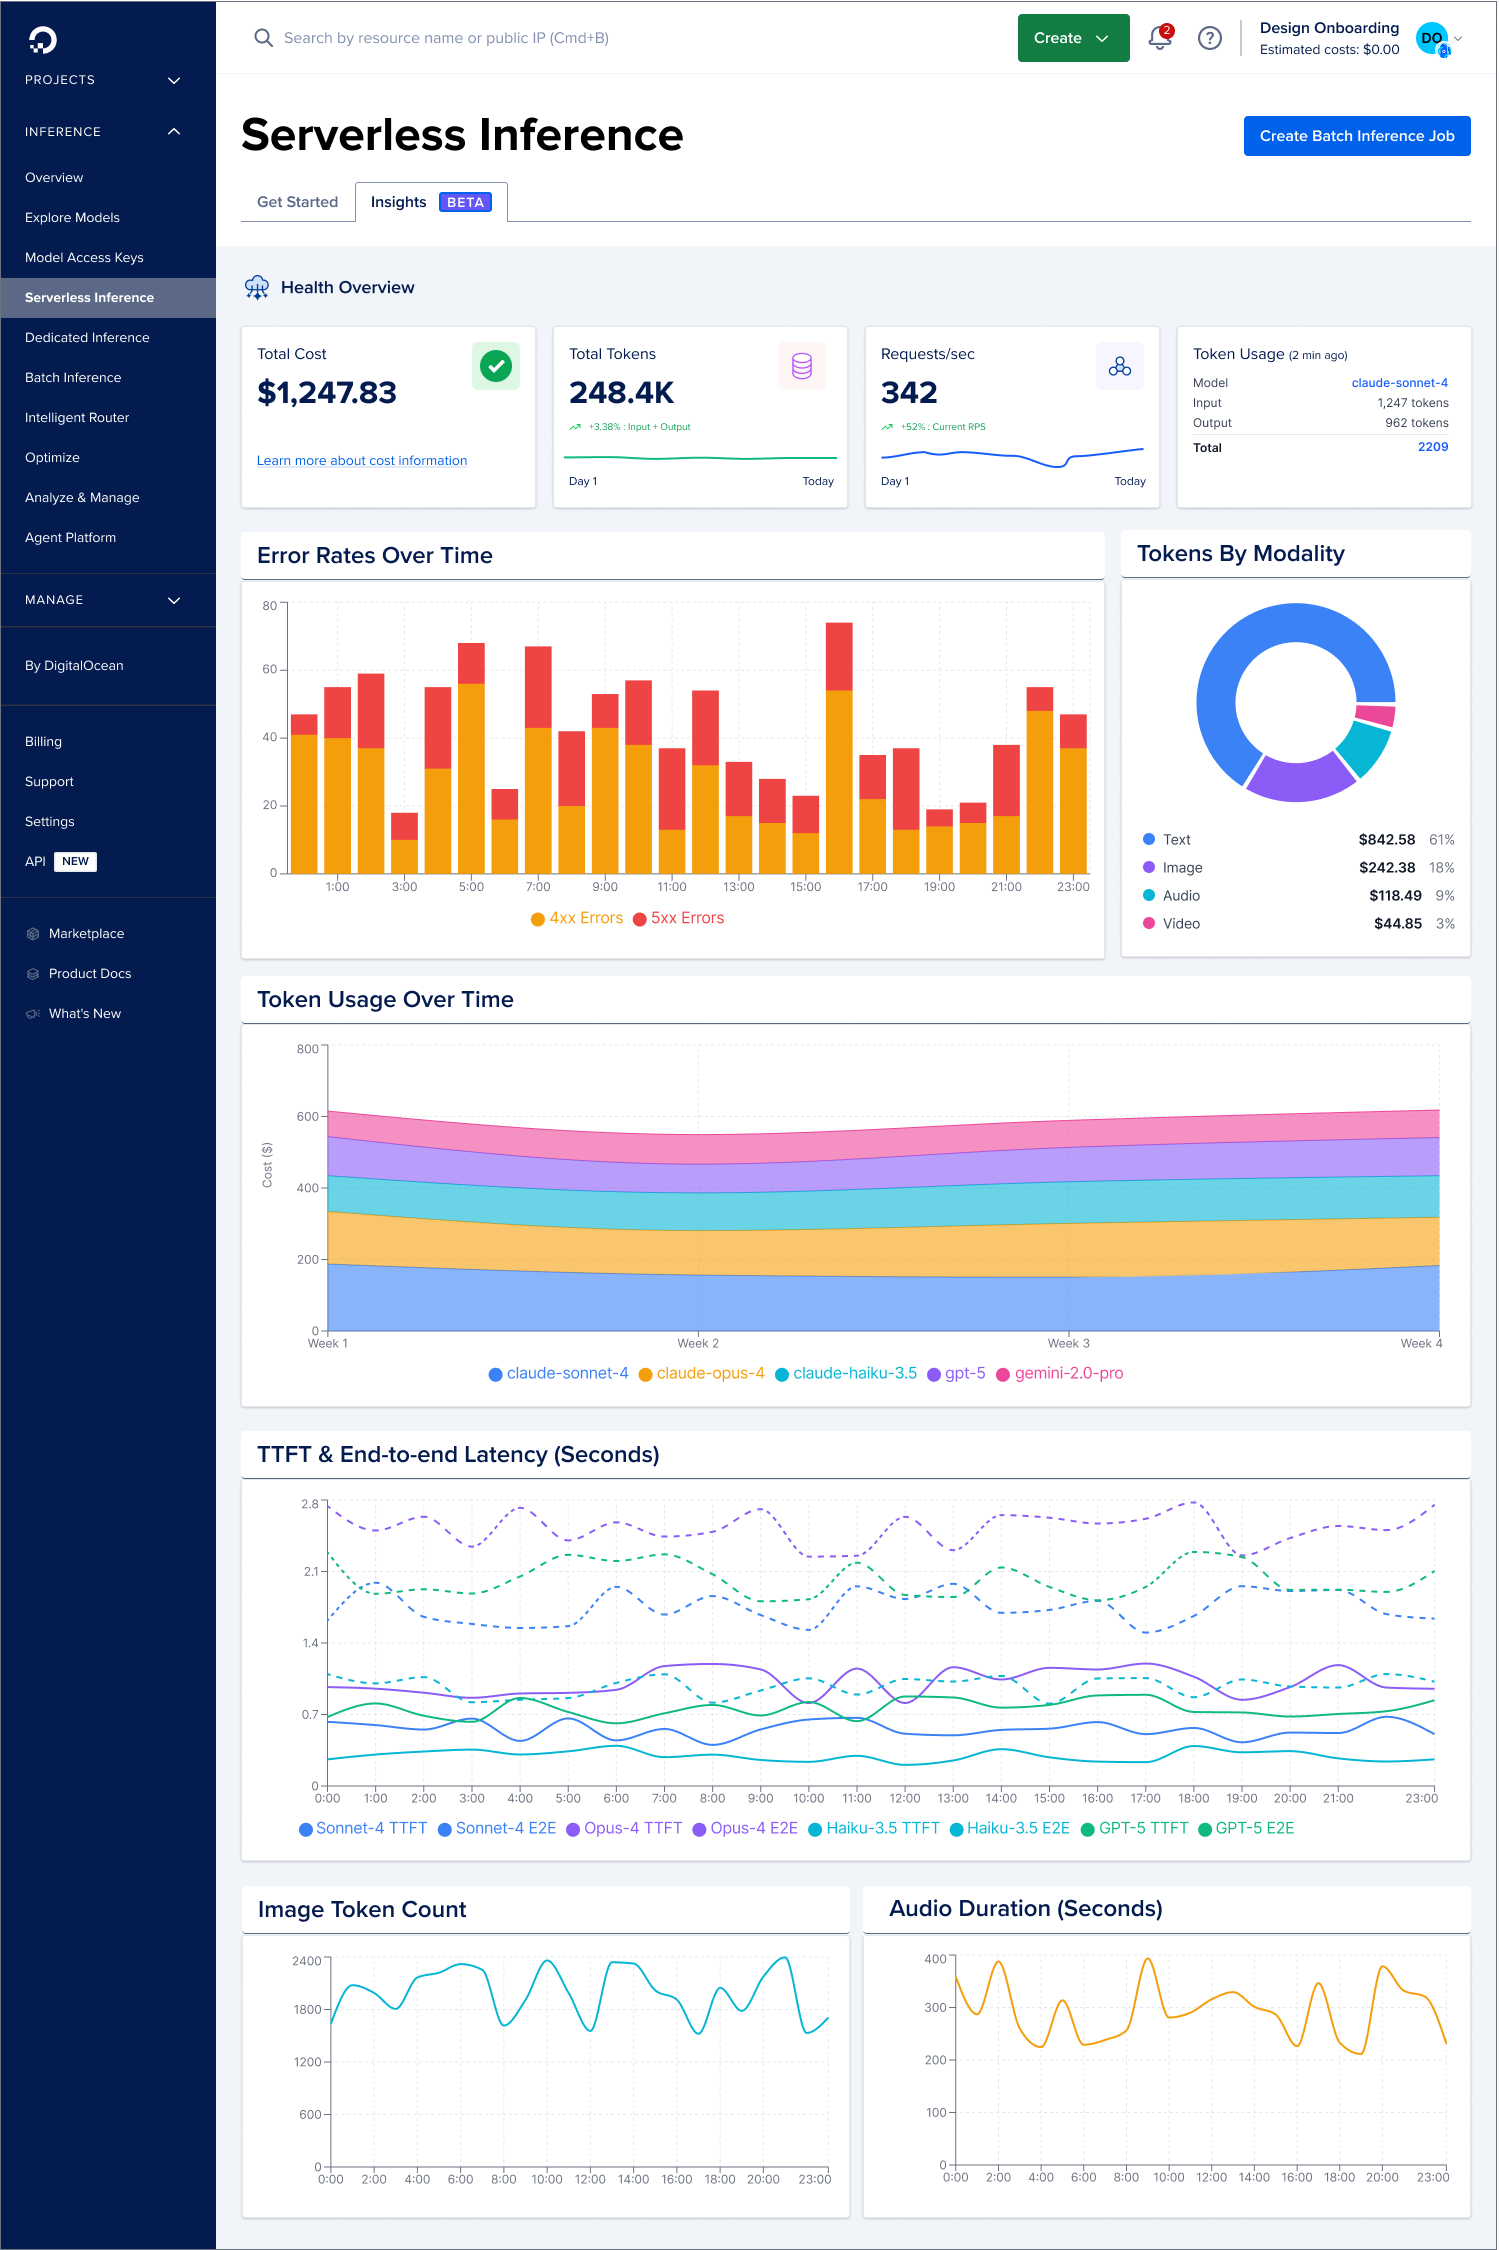
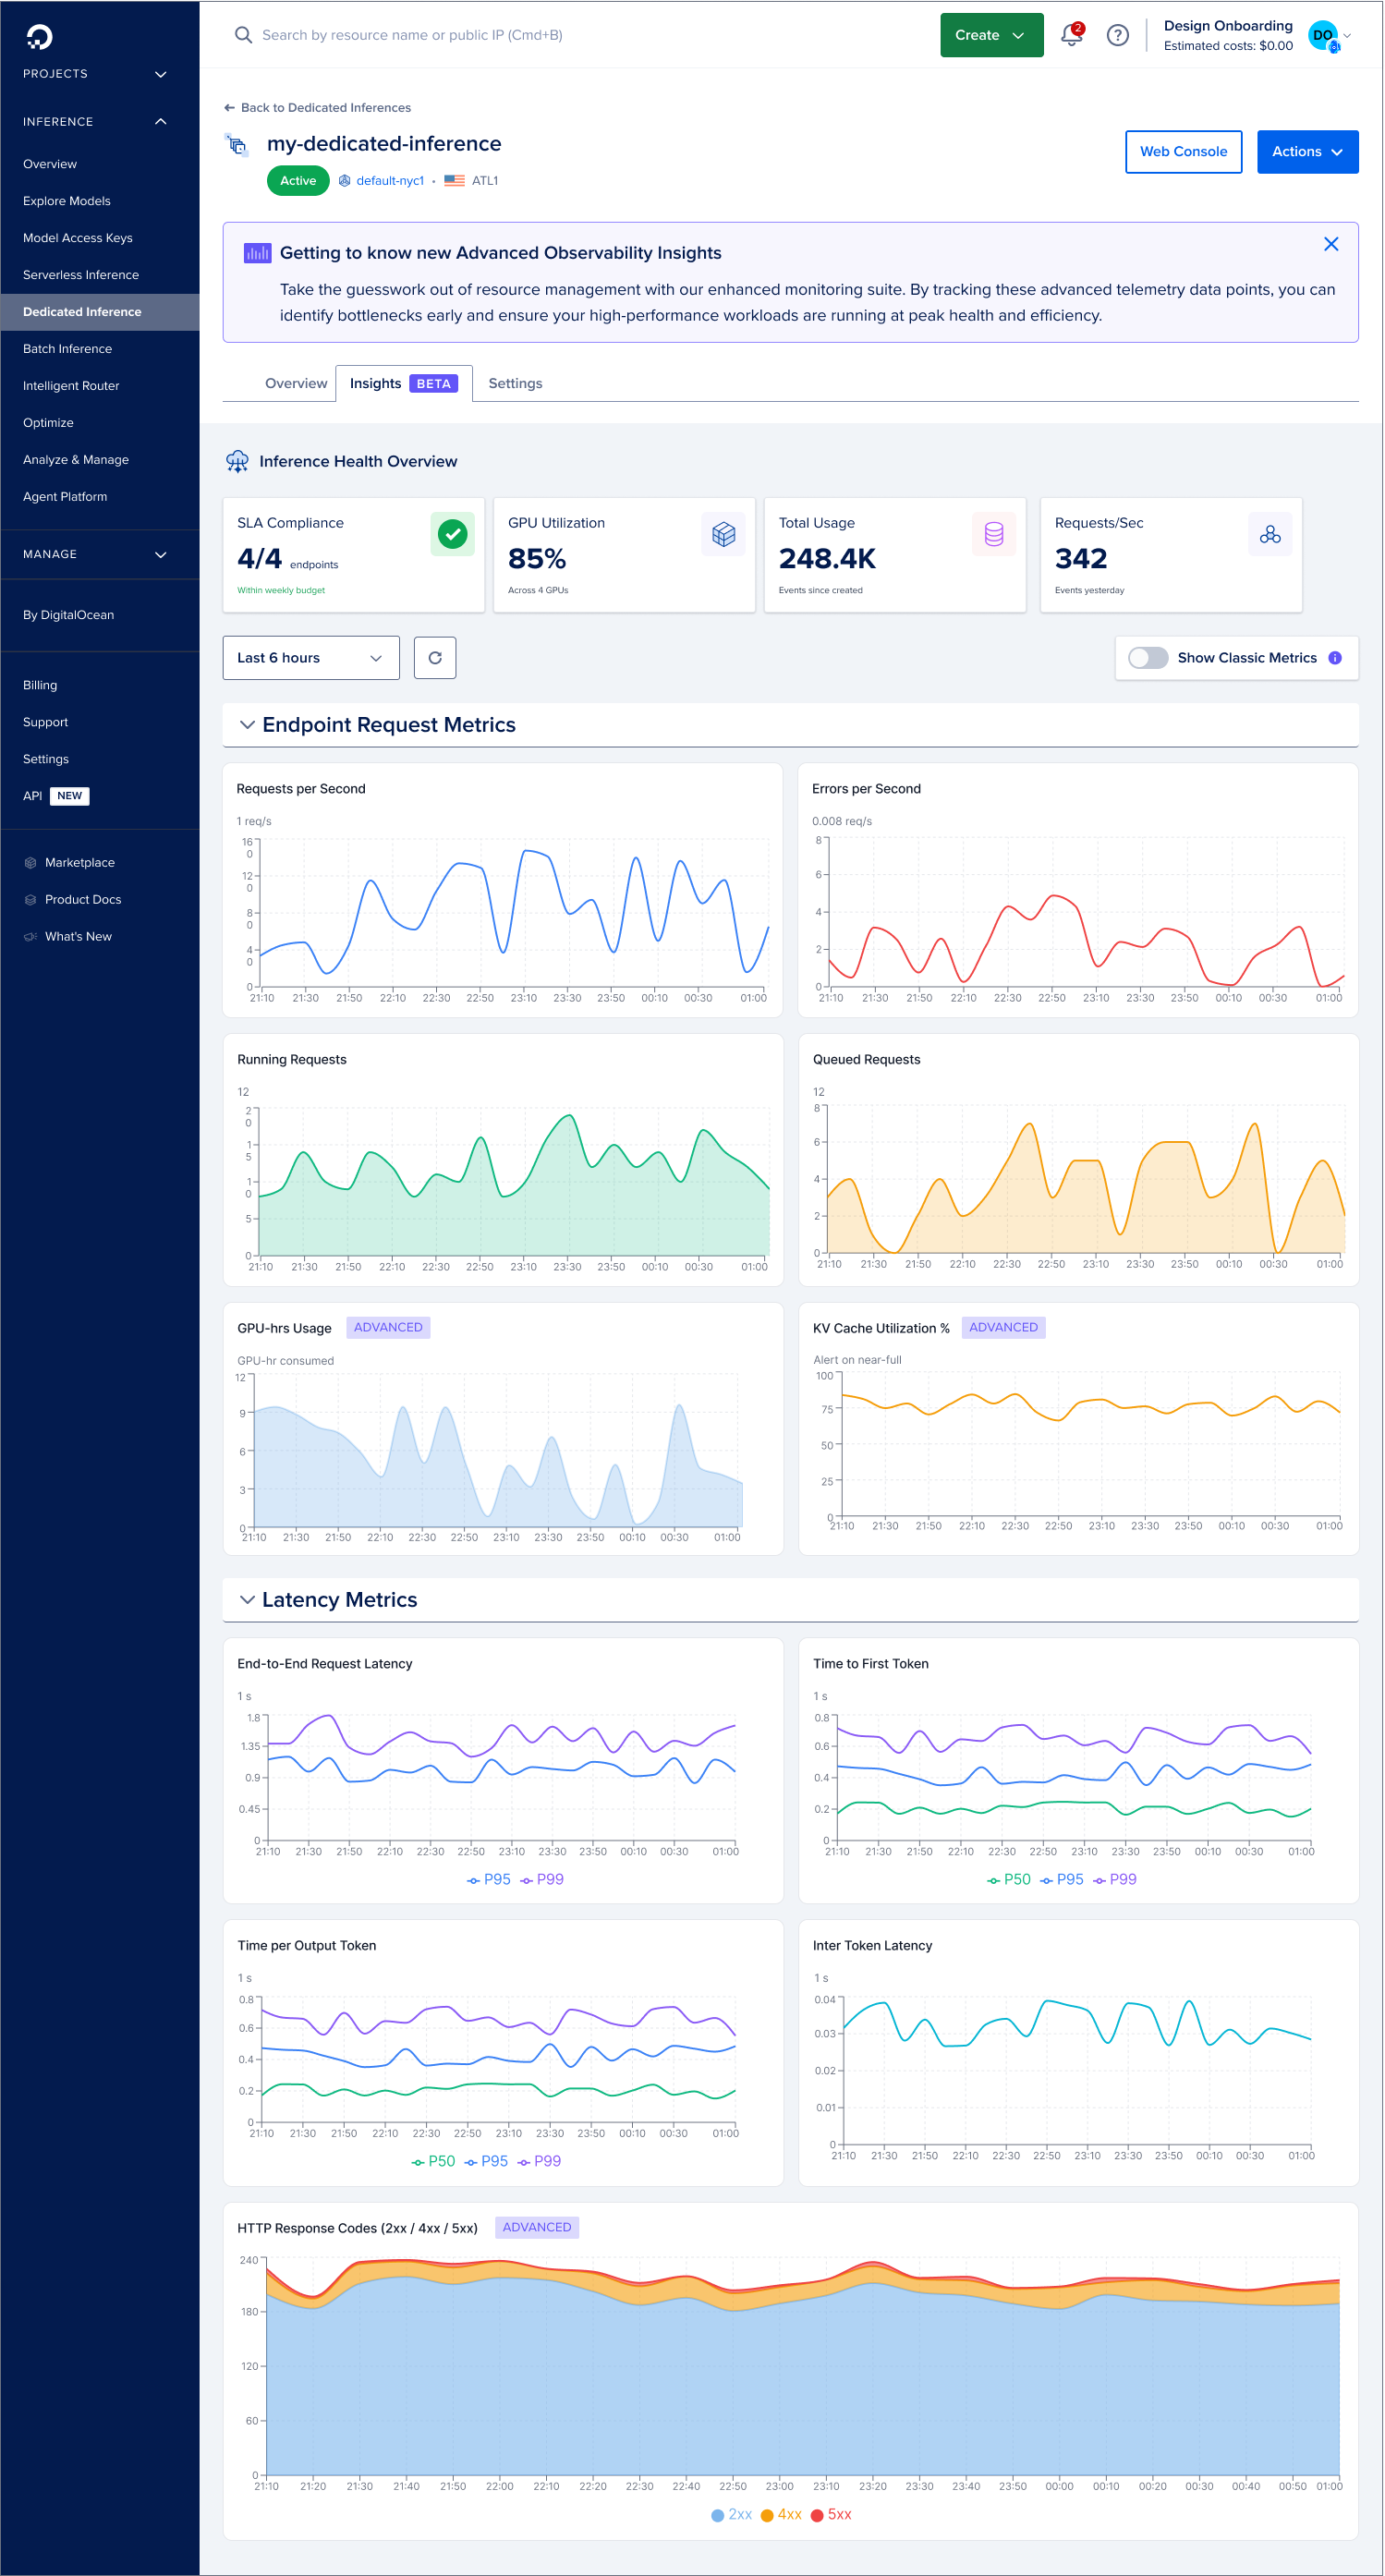
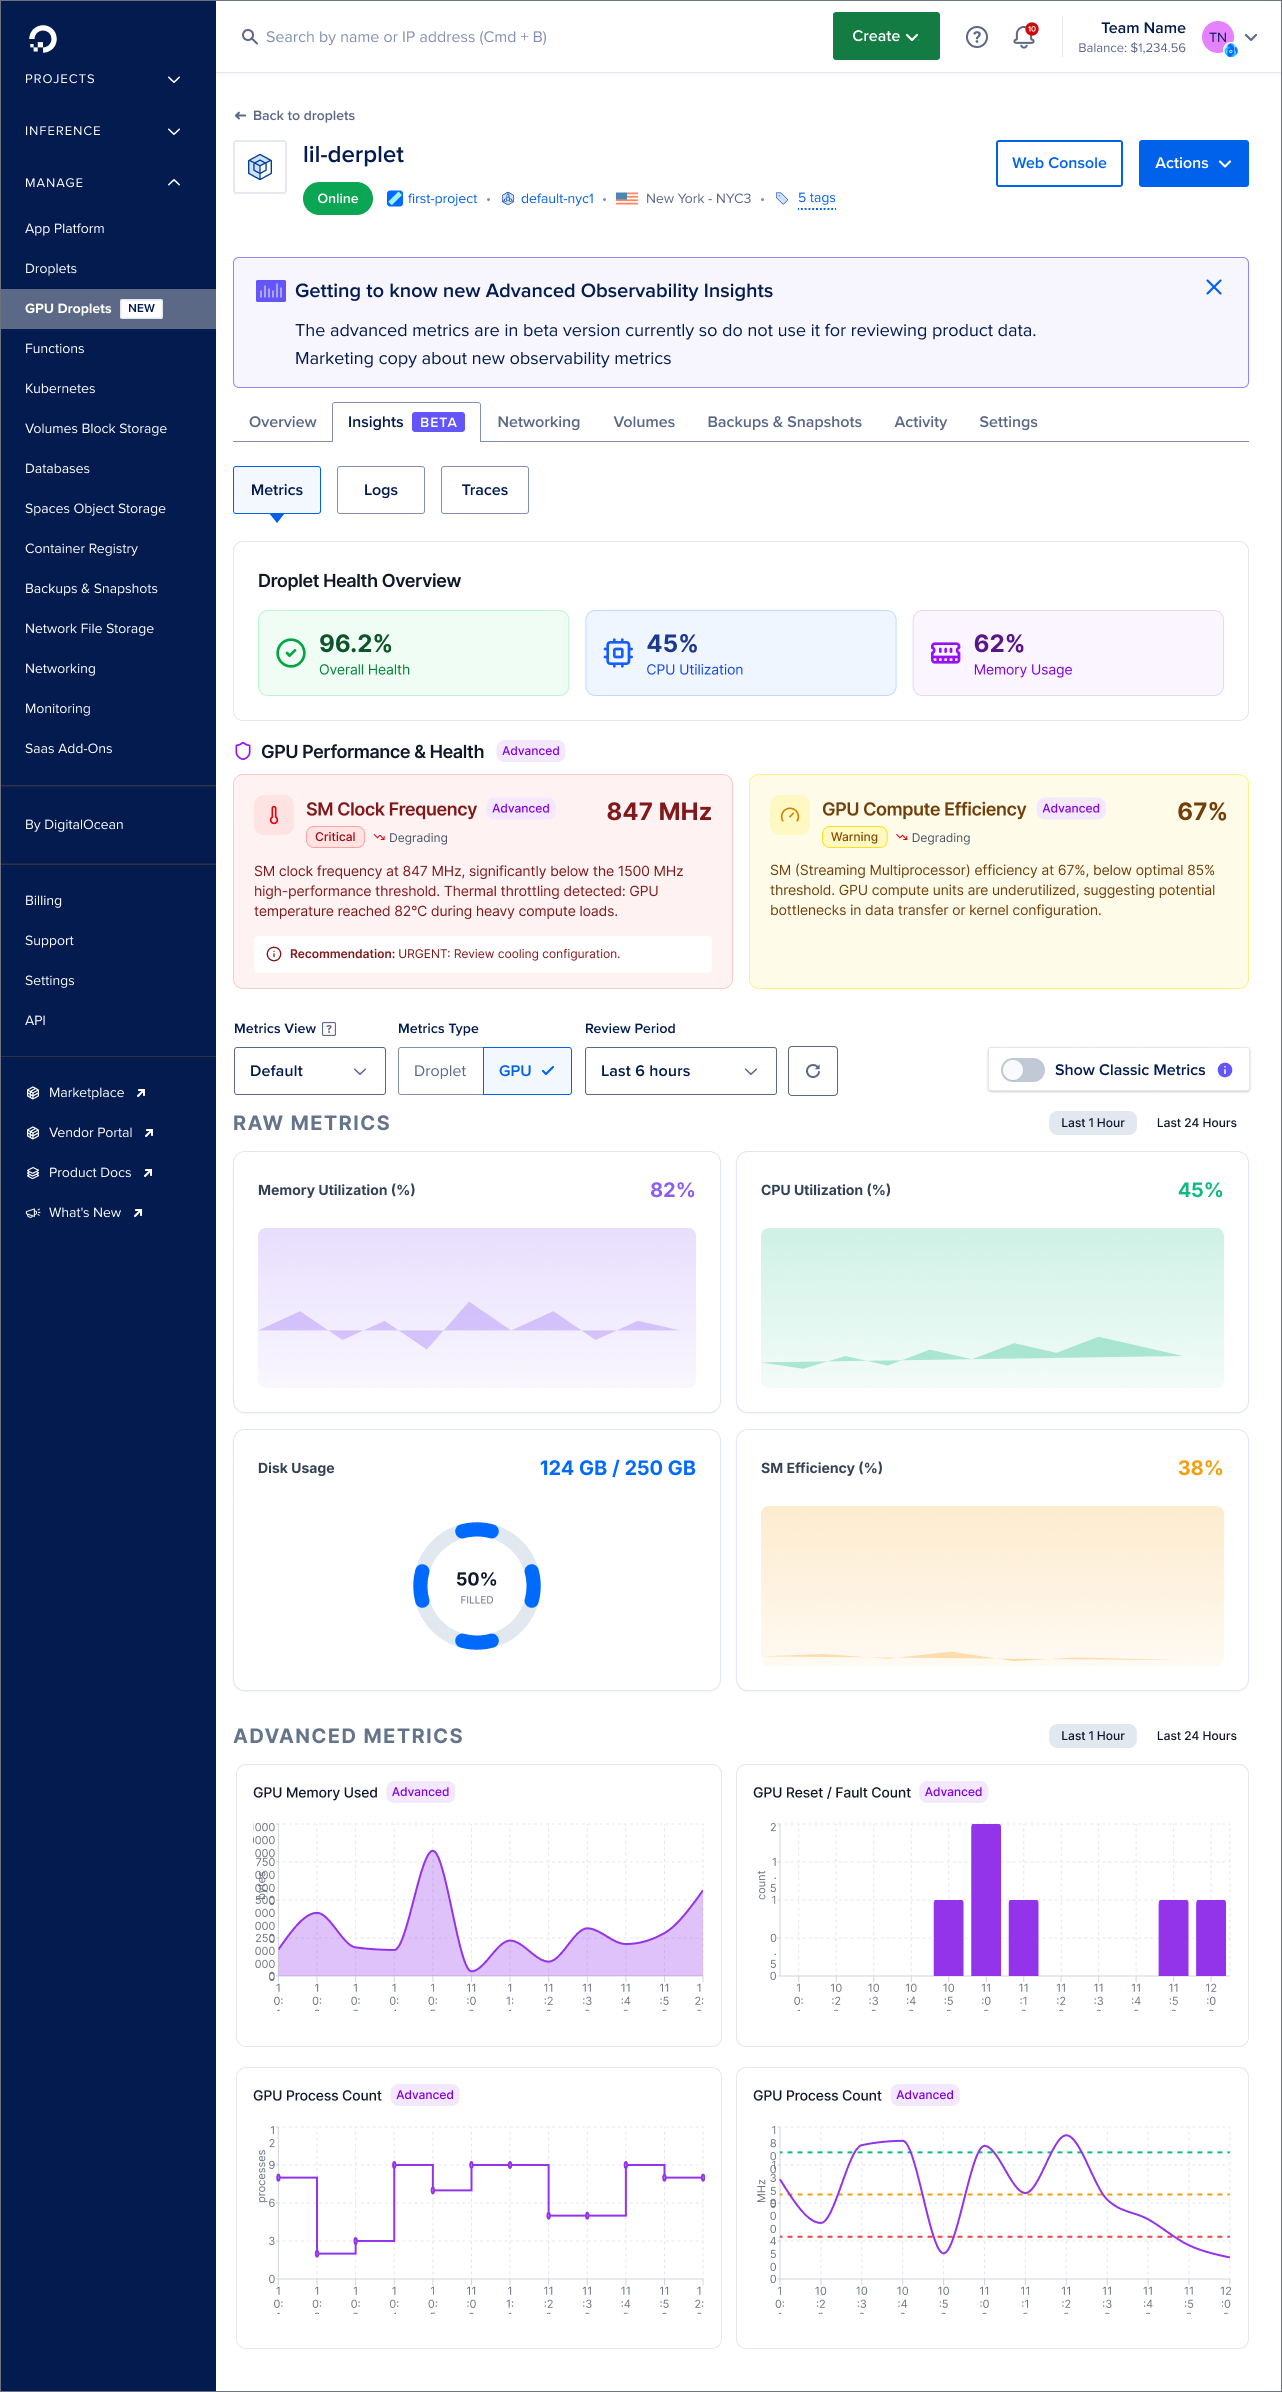
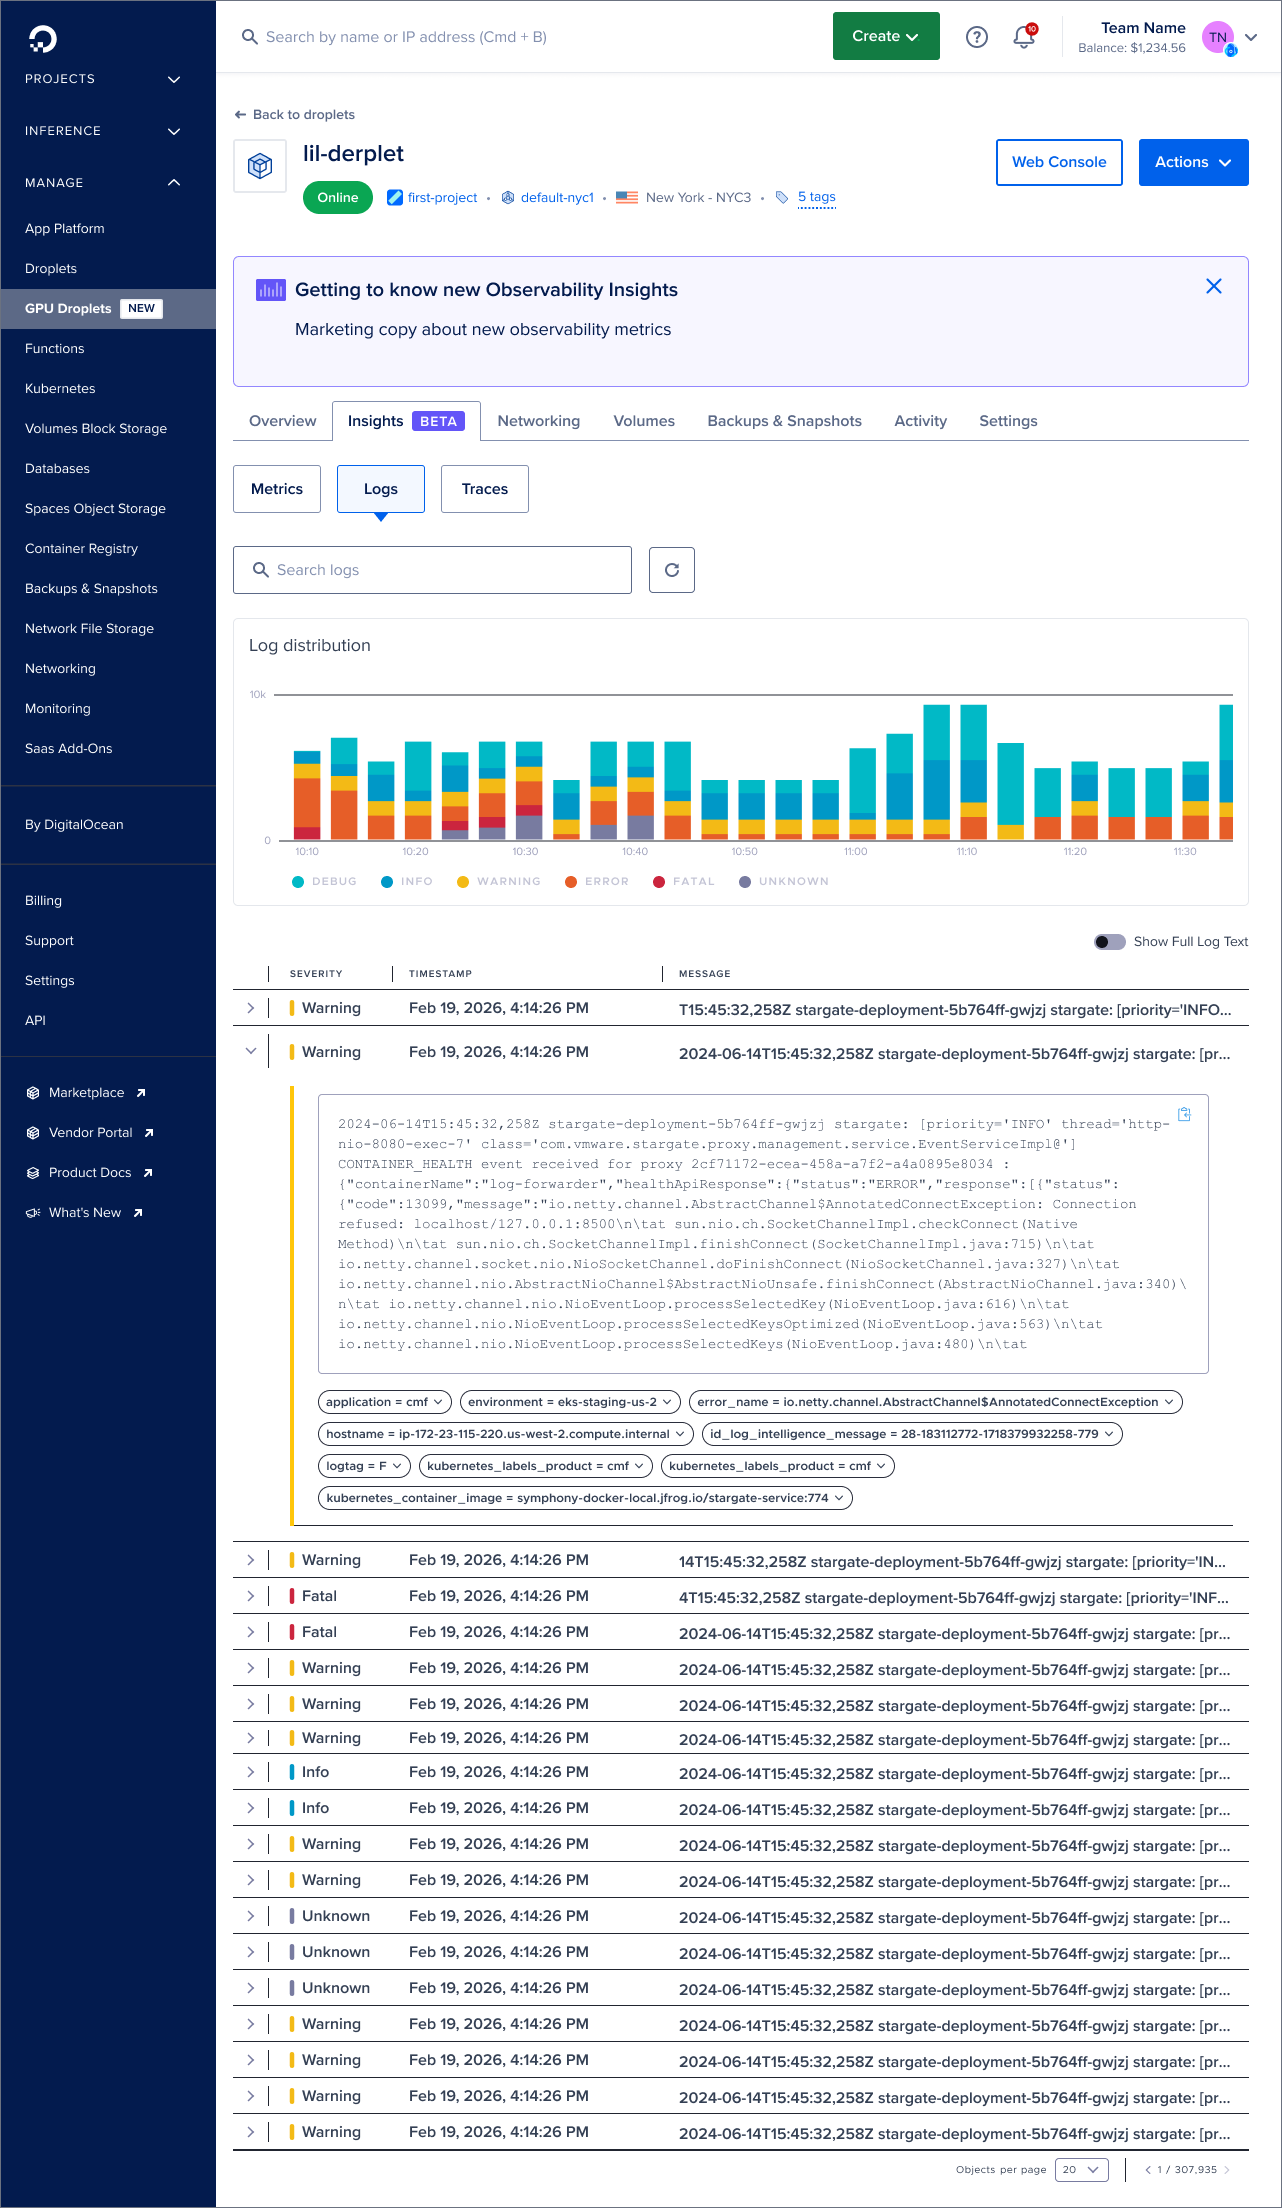
How it came together
Standardize the path, not the metrics
Every product shared one intent: understand health, investigate, decide what’s next. The signals differed, so I standardized the journey and let each product bring its own telemetry.
Turn telemetry into decisions
Exposing more data doesn’t make a product more useful. Where possible, the UI connects a signal to what it means and what to do about it.
Simple by default, deep on demand
Basic observability covers common monitoring workflows. Advanced telemetry and diagnostics are there for the users who need them, without crowding everyone else.
Constraint: three months, everything at once
There was no time to define, design, validate and hand off in sequence. Product definition, design and feasibility ran in parallel, so I worked with PM and engineering leads to decide what had to ship first without creating design debt that would block scaling later.